Welcome to the Kentucky Mesonet!
Navigation Bar: Our categorical drop-down menu neatly organizes all of our products in one place.
About: A category for our "just for reference" pages.
Live Data: A category for table, graph, and soil data pages.
Summary Data: A category for monthly and various yearly summaries.
Event Tracking: A category for live data formatted for tracking events as they happen.
![]()
Outreach: A category for our student research and education outreach programs.
Bug Reporting: A link at the bottom of the page has been included that enables fast, easy, and precise bug reporting. If you discover that something is amiss on our site, let us know!
Customizable Home Page: By registering, you can log in to your account and customize many features of your home page.
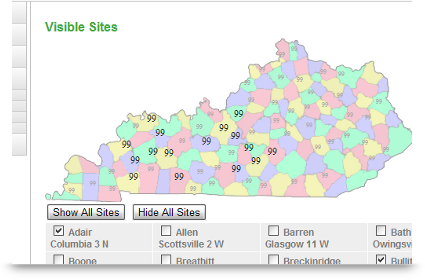
Visible Sites: You can decide exactly which sites you would like shown on the home page map.

Map Image: Choose from many different images for your home page map, including county colors, climate divisions, topography, time zones, and many more!
Map Appearance: Select from various styles for how data is displayed on your home page map.
Map Indicators: Create your own filters that apply just how you want to just the variables and value ranges that you want.
And Much, Much More:
Monthly Summaries: Look up summaries for any station, any month, and any year in only a matter of seconds.
Yearly Summaries: Look up and compare yearly summaries for each of our stations.
Winds/Gust: Track potential high winds across the commonwealth.
Precipitation: Track heavy precipitation across the commonwealth
Storm Front: With four side-by-side and color coded maps, track multi-variable data in near real time.
Drought: Compare expected, observed, anomaly, and percent of expected precipitation normals for each of our stations for the last 30, 60, 90, 120, or 180 days, giving you a clear visualization of drought developments.
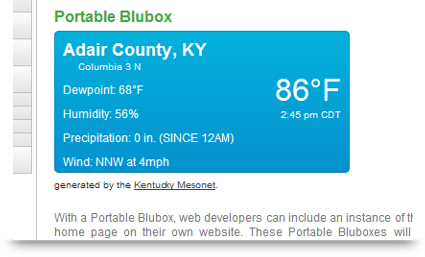
Portable Blubox: Have a website of your own? Log in and take your local weather to go and post it where you want with our new Portable Bluboxes!


