Overview
The Kentucky Mesonet provides a high-quality dataset for researchers across the Commonwealth. Students from all levels of the educational system participate in research extending knowledge of Kentucky weather and climate by using Mesonet data. The fine spatial and temporal scale of the Kentucky Mesonet observations provide a unique opportunity to study phenomenon that may escape detection by traditional observing systems.
Undergraduate Research
Use the links on the left to navigate various Mesonet related projects completed by undergraduates.
January 29, 2008 Squall Line
by Joseph Wilson and Jane Marie Wix, Western Kentucky University
in association with Zachary Brown, Megan Ferris, and Stuart Foster, Kentucky Mesonet
Synopsis
On January 29, 2008 a cold front stretching from Canada to Texas pushed its way across the middle of the country. This powerful cold front was associated with an Arctic air mass from northern Canada that brought drastic temperature changes throughout the country. The Northern Plain states saw 24-hour temperature changes of up to 50°F.
Mesoscale
A squall line developed in front of the fast approaching cold front that entered Kentucky around 6:00 pm CST. This line of storms brought damaging winds and heavy rains to Ohio, Indiana, Illinois, Kentucky, Tennessee, and Alabama. There were 309 storm reports associated with the squall line passage.
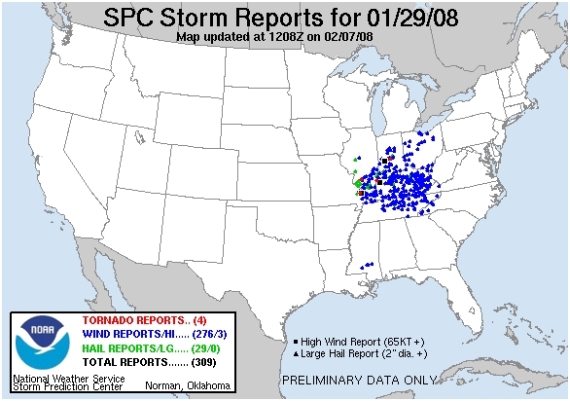
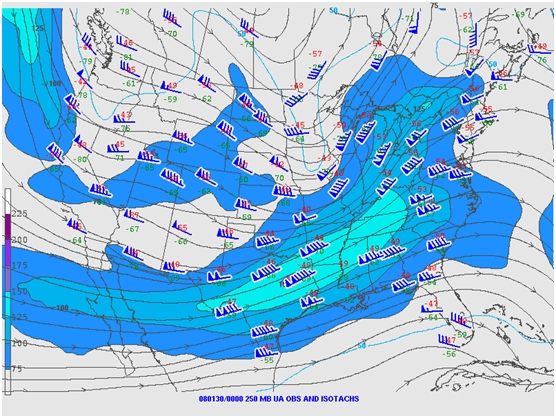
The vast majority of the storm reports from this system were wind reports due to straight line winds. The conditions in the upper atmosphere were not favorable for tornado development, although a few weak tornadoes did develop in the squall line. This particular storm system was powered by a strong jet streak that moved into Kentucky from the southwest. This pumped energy into the developing low pressure system. Jet streak energy is a key component in tornadic development; however, there was little warm air advection in the region, and not enough moisture in the atmosphere to produce long track tornadic supercells. As a result, a fast moving squall line with very active winds, yet little rotation, made its way into our region.
Mesonet Observations
All Mesonet sites recorded a dramatic drop in temperature, along with a spike in both wind speed and precipitation. In addition to straight line winds, a dramatic drop in temperature was the most noticeable feature of this storm with around 10°F temperature decreases within a 15 minute period. With the Mesonet stations spread across the Commonwealth, the squall line effects were seen in real time across the state with the changes in intensity which occurred along the way.
| Mesonet Sites | Max Wind Speed (MPH) | Temperature Drop (F) | Precipitation (in) |
| Calloway County | 59.95 | 17.76 | 0.14 |
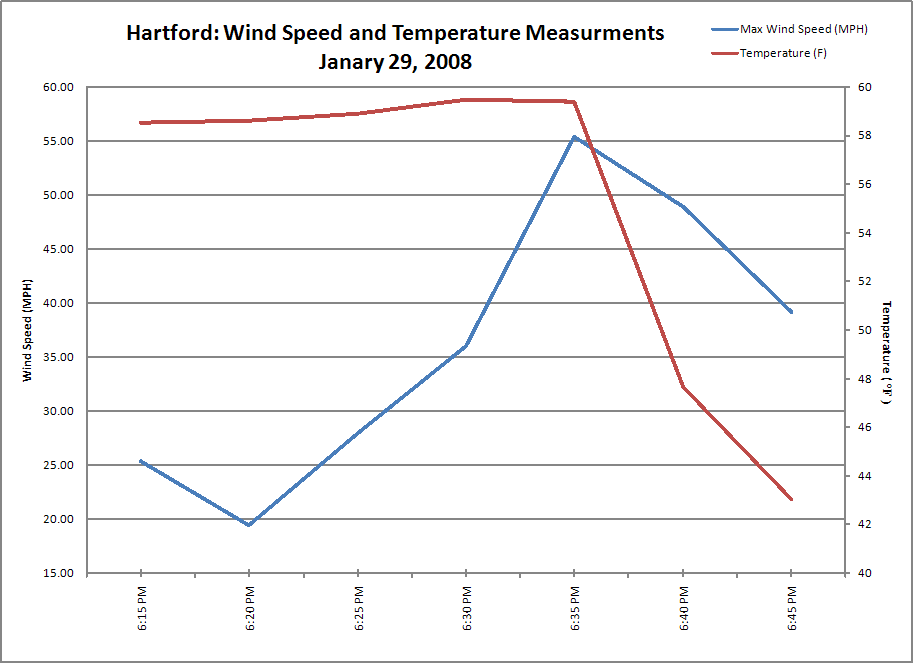
| Ohio County | 48.08 | 16.37 | 0.05 |
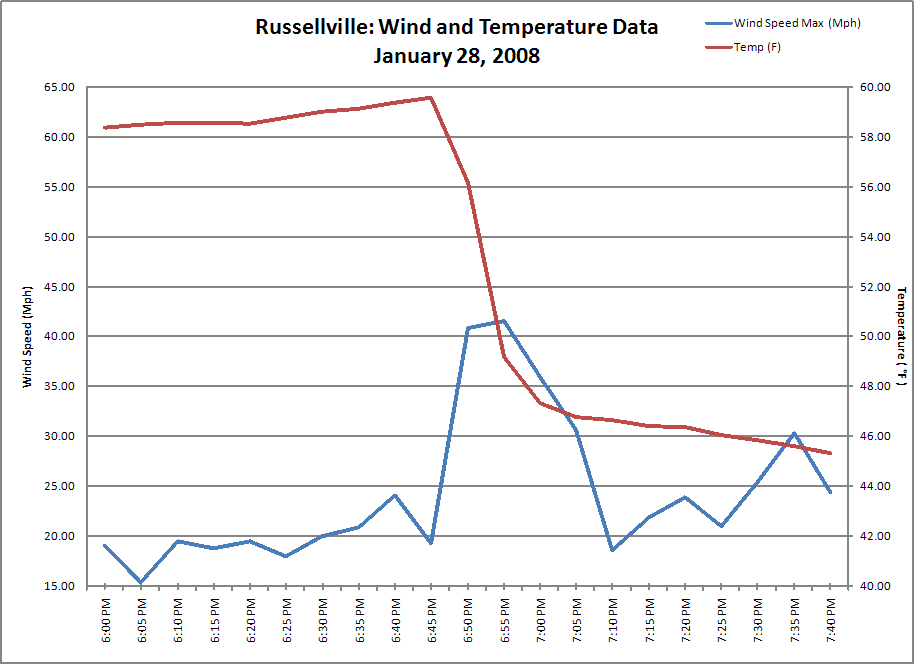
| Logan County | 41.58 | 14.21 | 0.12 |
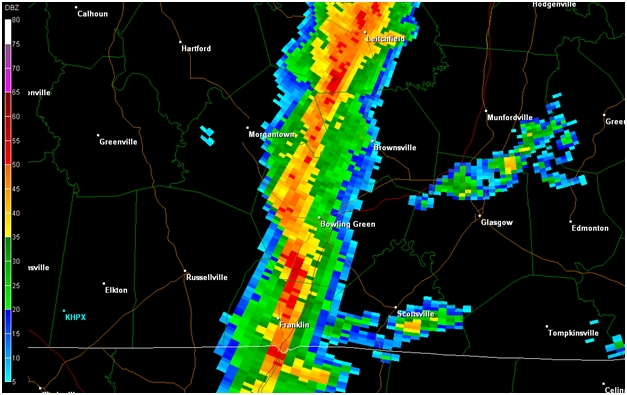
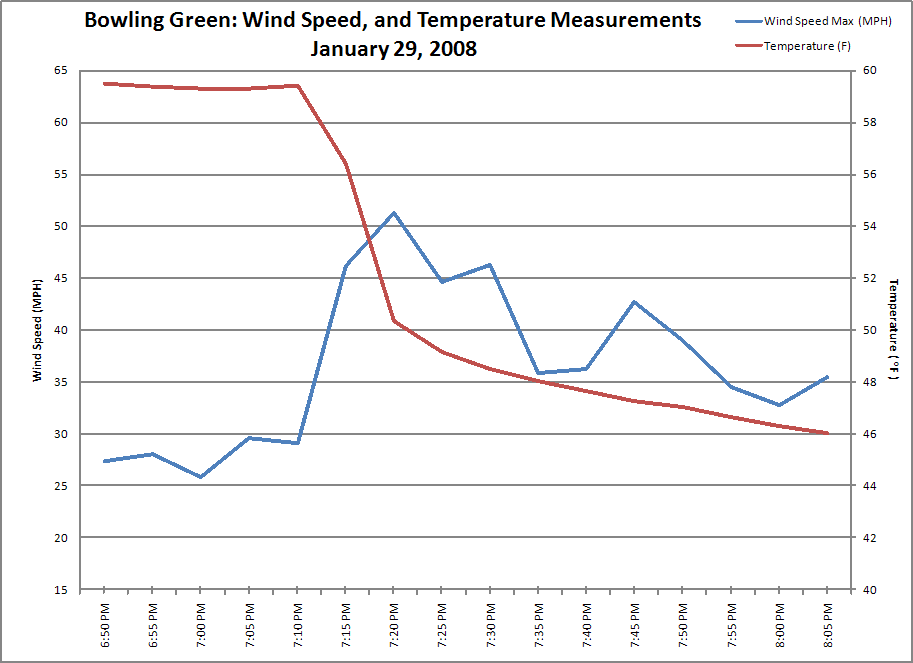
| Warren County | 51.29 | 13.39 | 0.12 |
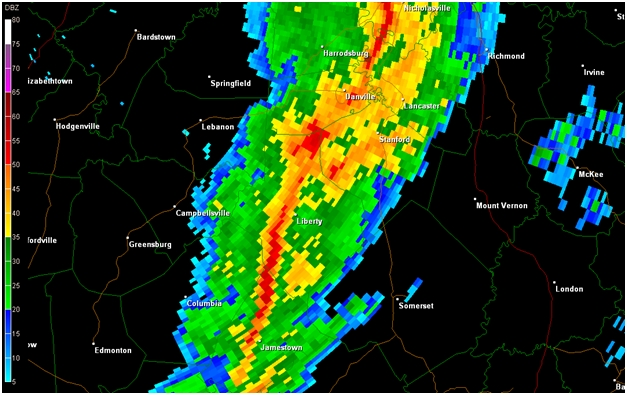
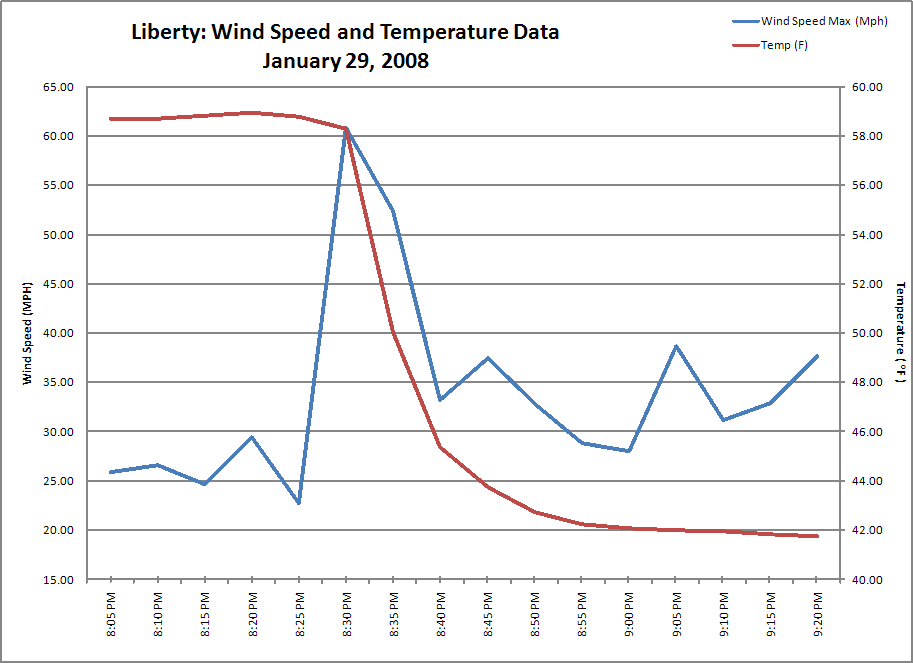
| Casey County | 60.08 | 16.69 | 0.13 |
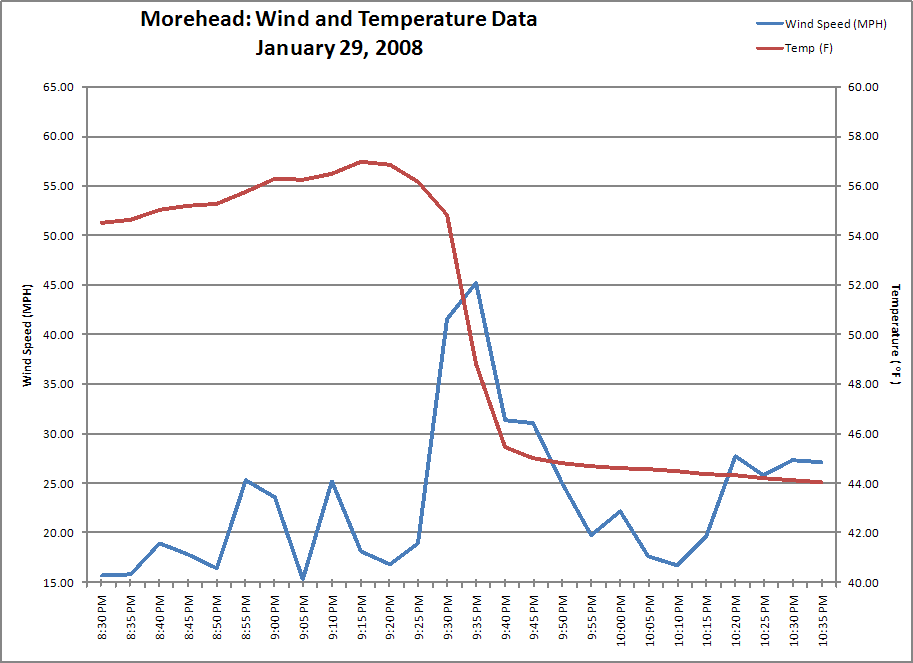
| Rowan County | 45.16 | 12.88 | 0.11 |
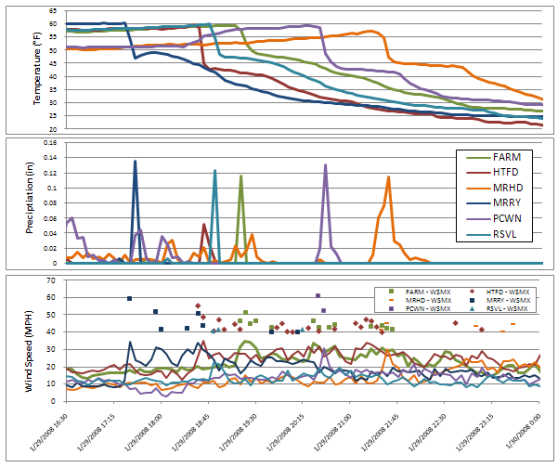
The graph below plots temperature, precipitation, and wind speed for all Mesonet stations on a continuous time axis. The progress of the squall line from west to east can be seen in the dropping temperatures, the downpours indicated by spikes in the precipitation plots, and by the jump in wind speeds at each station.
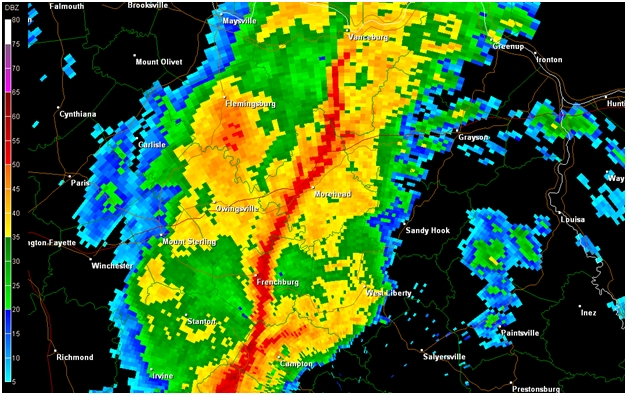
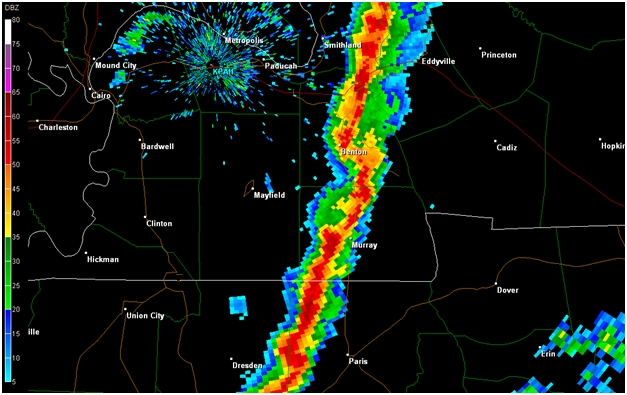
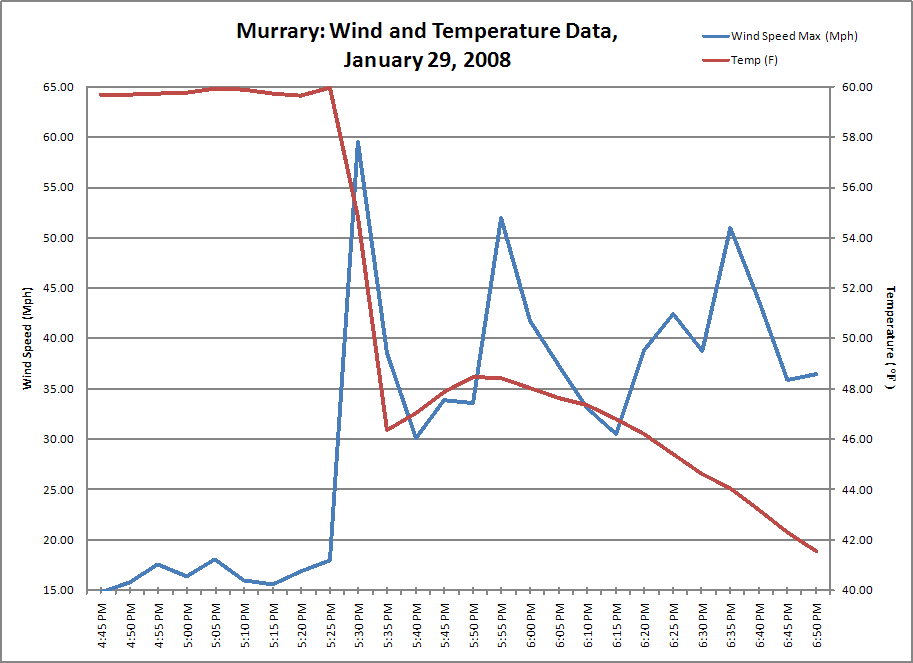
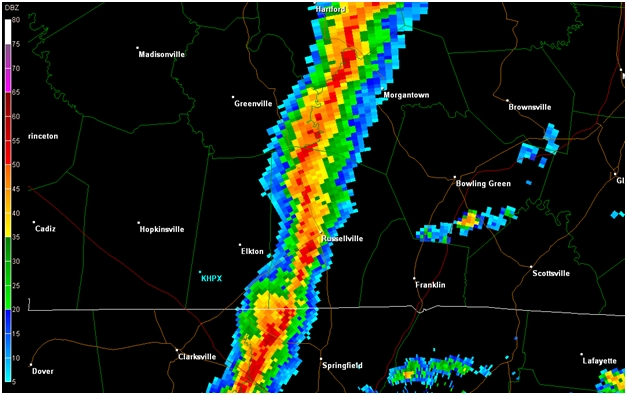
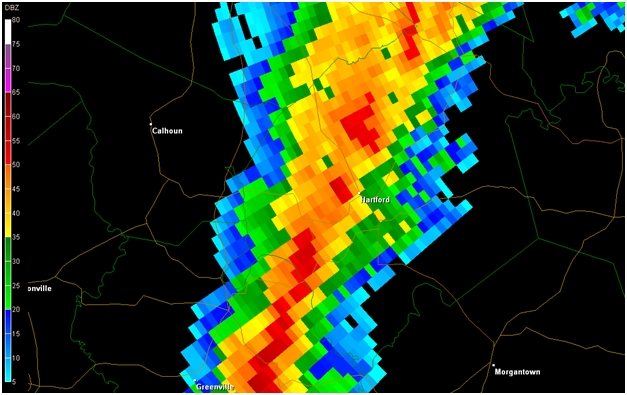
Graphs of temperature and wind speed were produced for each site. Also shown is a radar image of the squall line near the time of impact at each Mesonet site. The passage of the squall line is indicated in the graphs by a sharp drop in the temperature and a burst of high winds. Click the thumbnails below for full-size images.
Murray, KY (Calloway County)
Russellville, KY (Logan County)
Hartford, KY (Ohio County)
Bowling Green, KY (Warren County)
Liberty, KY (Casey County)
Morehead, KY (Rowan County)